Surface station model
The weather map is a fundamental tool in meteorology. At each location where instrumentation exists, we can represent the key weather elements in a concise way -- the surface station model.
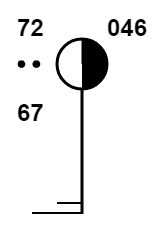
Surface station model example
Temperature and Dewpoint
The temperature at this station is 72 degrees F, and the dewpoint at this station is 67 degrees F. Temperature is always in the upper left, and dewpoint is always in the lower left.
Air Pressure
(Check with your instructor or in your assignment about whether you need to read this section.)
The 046 is an abbreviation for the sea-level pressure (SLP). There are two pieces to deciphering this code.
- Since the SLP should always be near 1000 mb -- more precisely, in a range from 950 mb to 1050 mb -- the leading "9" or "10" is dropped.
- The value on the station model is the SLP, reported to the tenths place, but with the leading digit(s) and the decimal place dropped.
So in this example, 046 --> 04.6 --> either 904.6 mb or 1004.6 mb --> 1004.6 mb is the right answer.
Additional examples: 132 corresponds to 1013.2 mb. 971 corresponds to 997.1 mb.
Cloud Cover
The amount of shading inside the circle tells us the amount of cloud coverage. In this example, the sky is half covered or "partly cloudy." Especially in our 100-level courses, the circle will be one of these:
- Empty, denoting clear.
- Quarter full, denoting partly cloudy or partly sunny.
- Half full, denoting partly cloudy.
- Three quarters full, denoting mostly cloudy.
- Completely full, denoting cloudy or overcast.
On professional maps, there may be greater distinctions (maybe in 1/8ths or even 1/10ths). We'll deal with those when we need to.
Wind Direction
"The line sticking off the circle" tells us the direction the wind is blowing FROM. Remember that we always, always, always describe the wind as where it is blowing from. Think of it as blowing back toward the center of the circle.
In this example, the wind is blowing from the south.
Wind Speed
The "barbs" that are sticking off the wind direction line give us the speed. Short barbs are 5 knots, long barbs are 10 knots, and we just tally up the totals. If we get to 50, we use a flag.

Image from aviationweather.gov
Current Weather
If there is any weather phenomena being observed, we put symbols centered on the left-hand side. There are over 100 different symbols we could use (gah!), so we'll need to talk about the most common ones in class. Normally, we won't go beyond: rain, snow, fog, thunderstorm, sleet, and freezing rain. If none of these things are happening, there is no symbol.
Here are the most fundamental weather symbols. These are the ones we'll memorize.

Most common weather symbols, from this page by the Weather Prediction Center: http://www.wpc.ncep.noaa.gov/html/stationplot_awc.shtml.
Those symbols are a subset of the one hundred official symbols! Just so you can see all the variations, here are those.

Image from aviationweather.gov
Practice
If you would like to look at more of the simple, clean surface maps like those we look at in class, here are some.
Below is the current surface weather map for the central United States. Each station model has a bit more information than we're interested in (related to visibility and also to how pressure is changing over time), but the key information is also there.
Pick a couple of locations. Let's say, St. Louis, Missouri, and Nashville, Tennessee. Can you decode those surface station models?